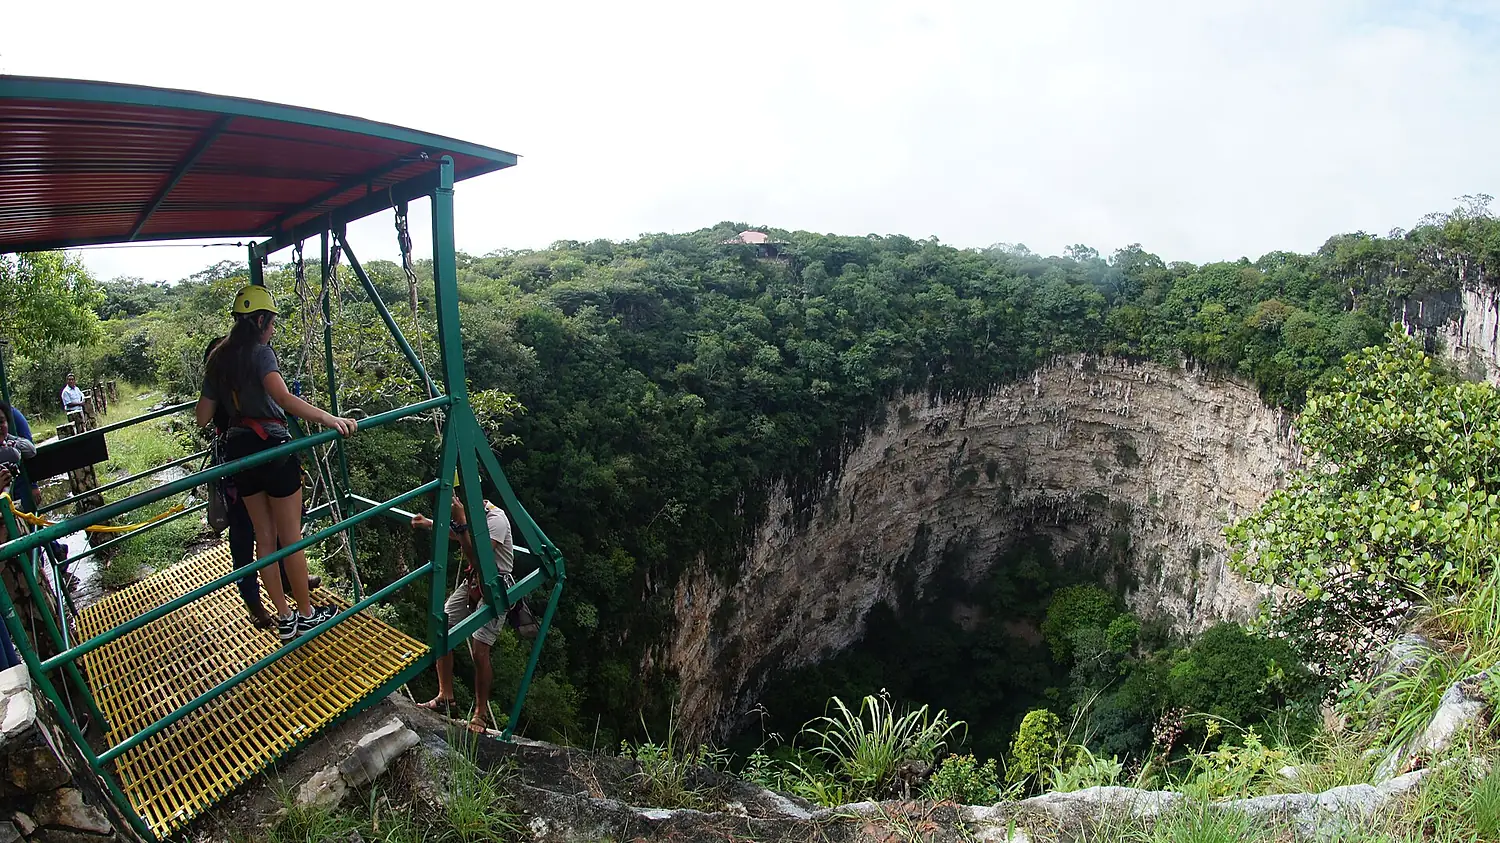
 Mexico
 Natalia Tejeda · CC BY-SA 4.0
The descent
The entrance, at 852 m.
The real relief above Sima de las cotorras, measured on the Copernicus model every 30 m, and the cave going down at the same vertical scale.
The depth is the one published by those who explored it; the shape of the galleries is a sketch, not a survey. No depth has been published for this cave yet.
852m
Entrance altitude
from the 30 m relief model
21°C
Inside, all year
the yearly average outside, at the entrance
86m
Rock above
the highest point within 1.5 km
Inside and outside
21 °C inside, all year.
Deep inside, a cave keeps the average temperature of the year outside: about 21 °C here, in January and in August. In May the afternoon reaches 30 °C at the entrance, 9 °C warmer than inside: take a jacket. The best months to escape the heat are from April to May. The wettest months are from June to October: water rises fast underground, so never go in without a guide after heavy rain.
- 21°13°Jan
- 23°14°Feb
- 26°15°Mar
- 30°17°Apr
- 30°19°May
- 27°20°Jun
- 26°19°Jul
- 26°19°Aug
- 25°19°Sep
- 24°18°Oct
- 22°16°Nov
- 22°14°Dec
Outside: afternoon and night averages for 1991–2020 (NASA POWER) brought to the altitude of the entrance. Inside: the yearly average, which deep parts of a cave keep. Near the entrance it follows the weather a little.
Sima de las cotorras is a cave in Mexico. The entrance is at 852 m.
Getting there.
- Wild cave: only with caving equipmentNo paths or lights inside. Go only with a caving club or a qualified guide.
- Ocozocoautla de Espinosanearest town · 12 km in a straight line
- Angel Albino Corzo International Airport (TGZ)nearest airport with scheduled flights · 55 km in a straight lineCar hire at VSA airport (Villahermosa)Discover Cars · sponsored link↗
Plan the visit
Guided tours, a bed nearby, a car.
Some links above are affiliate links: if you book through them we may earn a commission, at no extra cost to you. It never changes what the data on this page says.
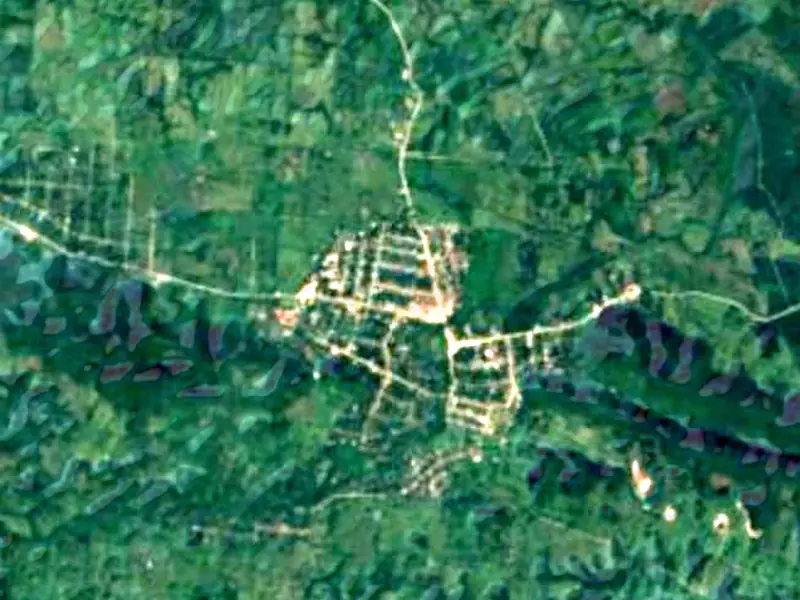
From above.
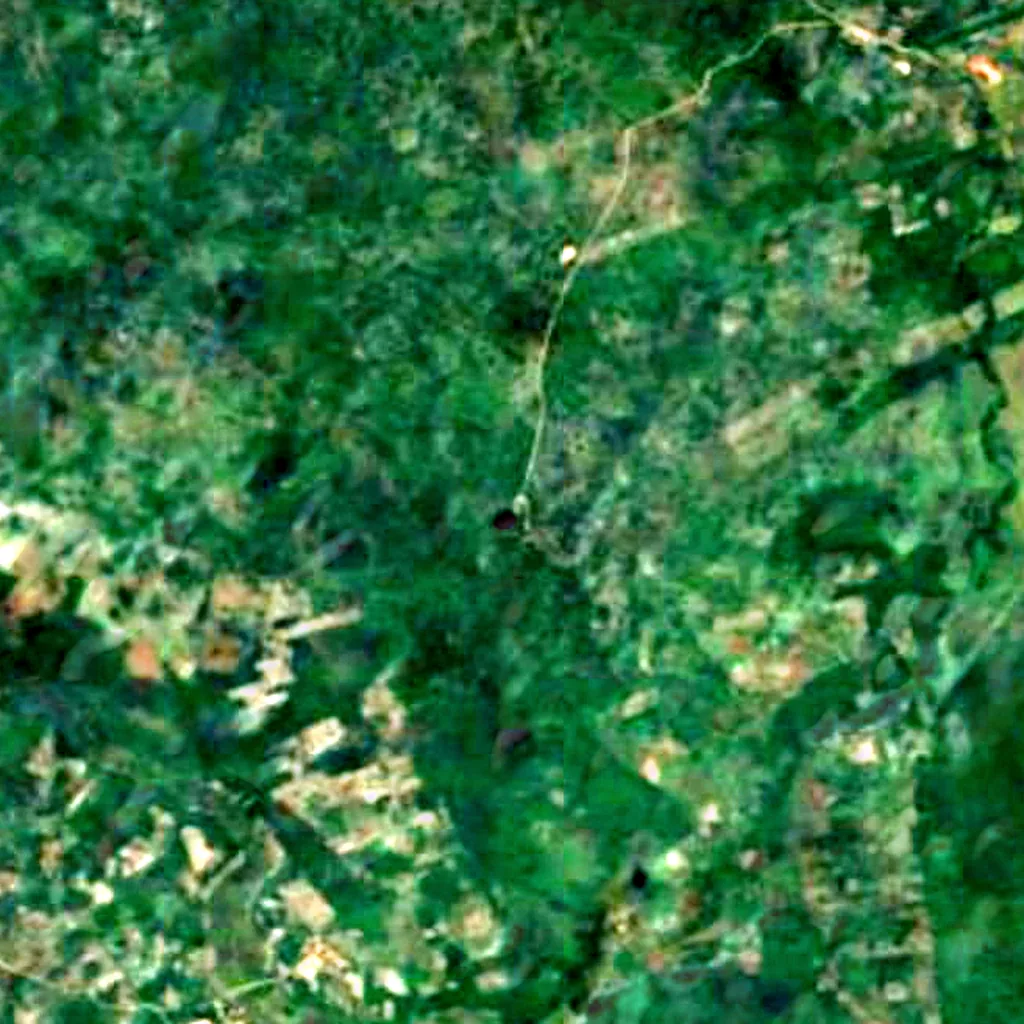
The ground above the cave, with the relief shaded, the line of the section and what people have mapped around the entrance.
 N
1.5 km
N
1.5 km
Sentinel-2 cloudless 2016 (EOX, CC BY 4.0), 6.0 × 6.0 km, north up. The line is the section above. Points © OpenStreetMap contributors.
Around the entrance.
- 2campsites within 8 kmCascadas el aguacero
- 1hotels and guesthouses within 8 kmSima of the Parrots
- 1restaurants and cafés within 3 km
- other cave entrances within 3 km
- springs within 2 km
- sinkholes within 3 km
- caving clubs and spots within 15 km
- viewpoints within 3 km
- marked hiking routes within 3 km
- climbing crags within 3 km
- named waterfalls within 4 km
- car parks within 2 km
- information boards and visitor centres within 3 km
- bus stops within 2 km
Counted in OpenStreetMap, the map anyone can edit, around the entrance. A low number may just mean nobody has mapped it yet. © OpenStreetMap contributors (ODbL).
Towns nearby
- Ocozocoautla de Espinosa12 km in a straight line
- Alfonso Moguel16 km in a straight line
- Vicente Guerrero20 km in a straight line
- Berriozábal22 km in a straight line
- Las Maravillas24 km in a straight line
- Jiquipilas24 km in a straight line
- Quintana Roo24 km in a straight line
Month by month
The weather outside, at the entrance.
| Jan | Feb | Mar | Apr | May | Jun | Jul | Aug | Sep | Oct | Nov | Dec | |
|---|---|---|---|---|---|---|---|---|---|---|---|---|
| Afternoon | 21 | 23 | 26 | 30 | 30 | 27 | 26 | 26 | 25 | 24 | 22 | 22 |
| Afternoon | 21 | 23 | 26 | 30 | 30 | 27 | 26 | 26 | 25 | 24 | 22 | 22 |
| Night | 13 | 14 | 15 | 17 | 19 | 20 | 19 | 19 | 19 | 18 | 16 | 14 |
| Rain (mm) | 78 | 50 | 41 | 41 | 118 | 274 | 207 | 271 | 343 | 251 | 140 | 84 |
| Rainy days | 11 | 9 | 7 | 8 | 17 | 26 | 27 | 28 | 29 | 23 | 16 | 12 |
| Sun hours/day | 4.1 | 5.3 | 6.6 | 7.3 | 7.0 | 6.6 | 7.0 | 6.6 | 5.7 | 5.3 | 5.1 | 4.7 |
| Afternoon | Afternoon | Night | Rain (mm) | Sun hours/day | |
|---|---|---|---|---|---|
| Jan | 21 | 21 | 13 | 78 | 4.1 |
| Feb | 23 | 23 | 14 | 50 | 5.3 |
| Mar | 26 | 26 | 15 | 41 | 6.6 |
| Apr | 30 | 30 | 17 | 41 | 7.3 |
| May | 30 | 30 | 19 | 118 | 7.0 |
| Jun | 27 | 27 | 20 | 274 | 6.6 |
| Jul | 26 | 26 | 19 | 207 | 7.0 |
| Aug | 26 | 26 | 19 | 271 | 6.6 |
| Sep | 25 | 25 | 19 | 343 | 5.7 |
| Oct | 24 | 24 | 18 | 251 | 5.3 |
| Nov | 22 | 22 | 16 | 140 | 5.1 |
| Dec | 22 | 22 | 14 | 84 | 4.7 |
Averages 1991–2020 (NASA POWER) for a cell about 55 km wide, brought to the altitude of the entrance (852 m) with the standard lapse rate. Not a forecast.
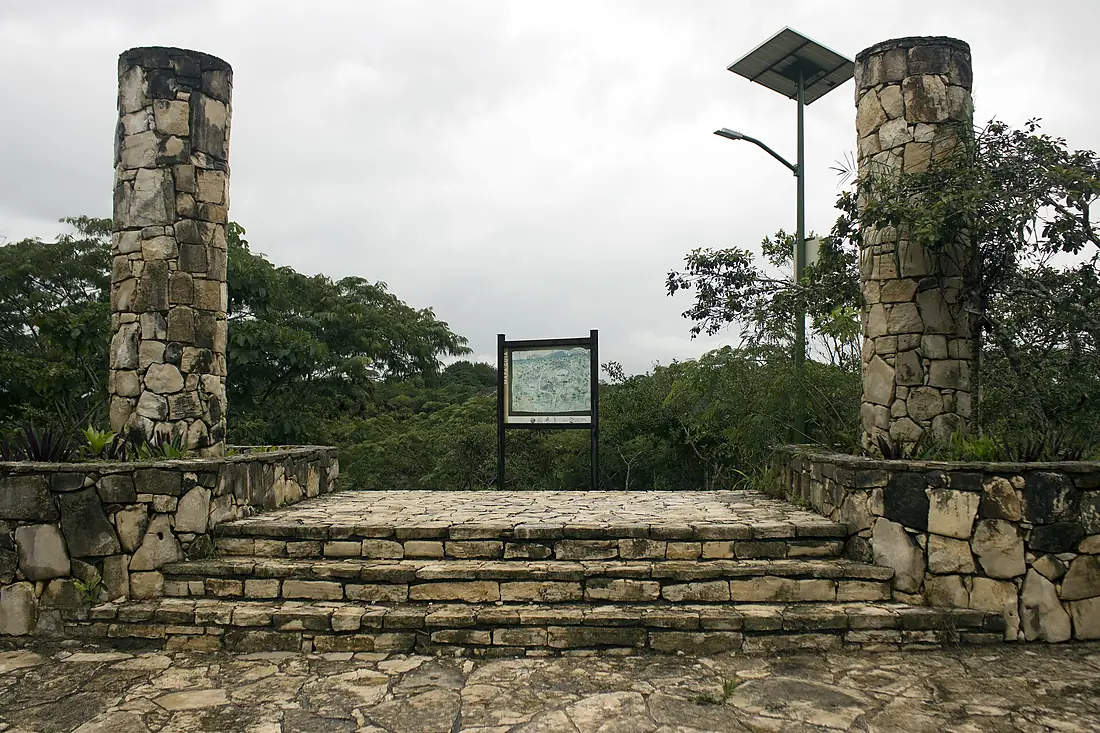
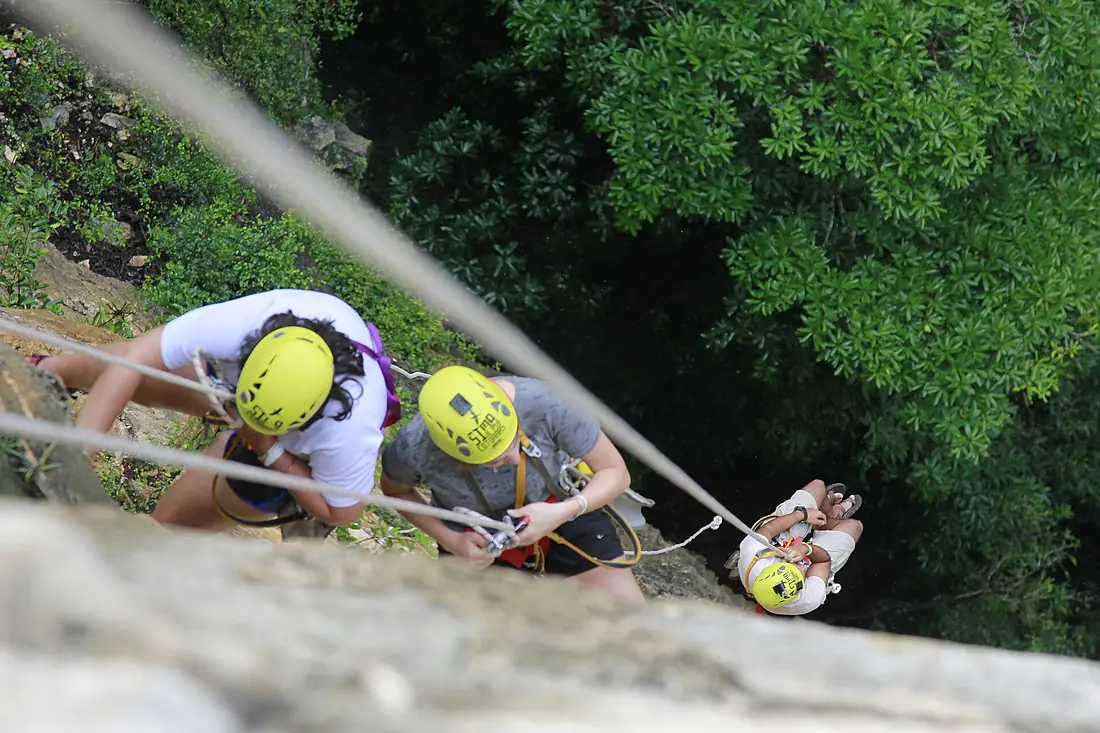
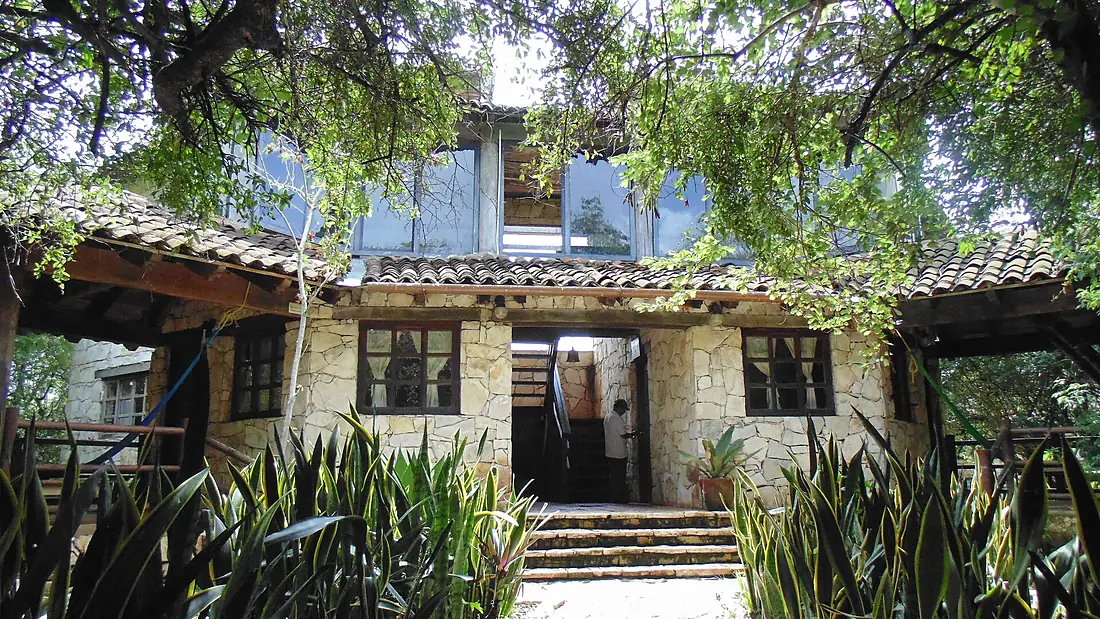
Photographs
Inside and around.
Recent years
Wet years, dry years.
Rain of each month as a share of the 1991–2020 average. A dry year means a lower river and hotter rock; a wet one, more water in the gorge.
| Jan | Feb | Mar | Apr | May | Jun | Jul | Aug | Sep | Oct | Nov | Dec | |
|---|---|---|---|---|---|---|---|---|---|---|---|---|
| 2020 | 56% | 228% | 39% | 88% | 169% | 161% | 74% | 104% | 98% | 139% | 257% | 123% |
| 2021 | 148% | 52% | 126% | 74% | 165% | 109% | 63% | 84% | 94% | 115% | 84% | 65% |
| 2022 | 192% | 345% | 108% | 150% | 107% | 122% | 81% | 88% | 119% | 86% | 117% | 133% |
| 2023 | 144% | 271% | 93% | 18% | 33% | 38% | 138% | 70% | 60% | 92% | 180% | 128% |
| 2024 | 98% | 43% | 27% | 39% | 23% | 135% | 115% | 67% | 88% | 120% | 44% | 59% |
| 2025 | 96% | 164% | 65% | 62% | 83% | 115% | 62% | 82% | 85% | 91% | 40% | 151% |
130% or more: wet month 70% or less: dry month
Caves nearby.
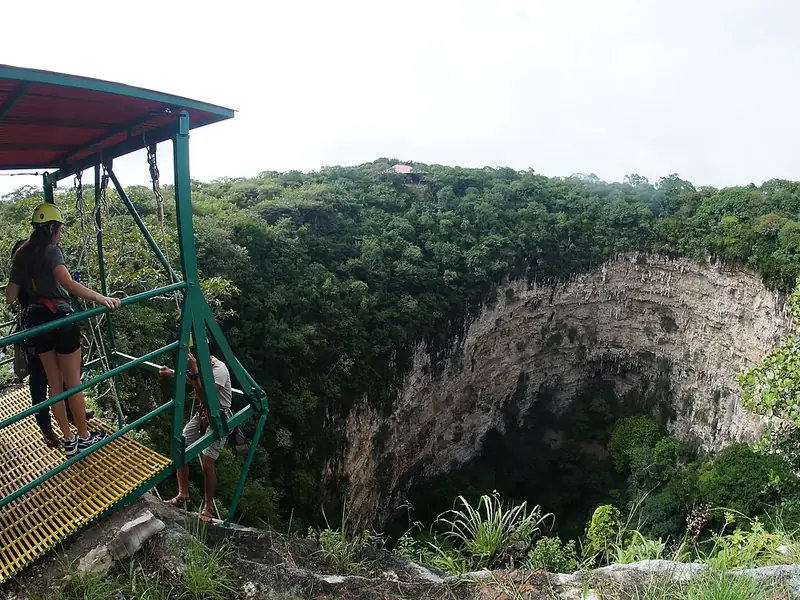
Sima de las cotorras
Mexico
- —Depth
- —Galleries
- 852 mEntrance altitude
- 21 °CInside, all year
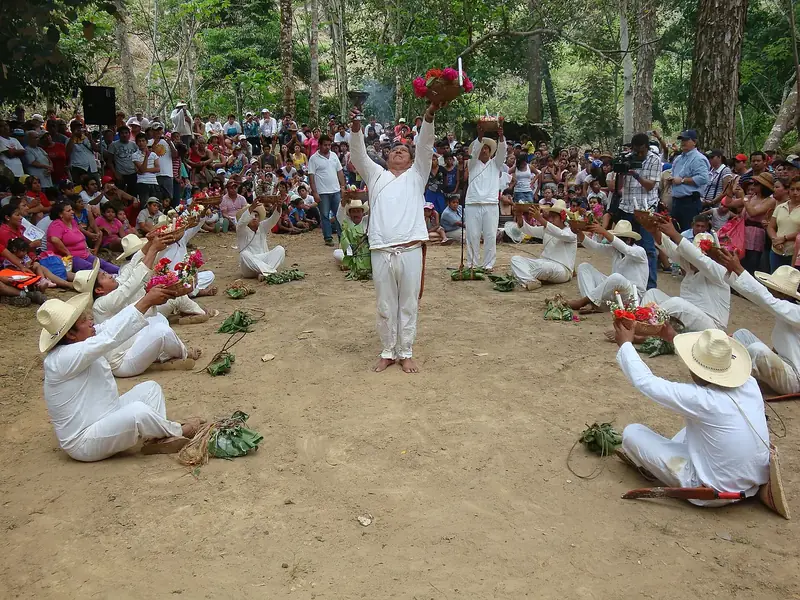
Cueva de Villa Luz
Mexico · 103 km
- —Depth
- —Galleries
- 69 mEntrance altitude
- 26 °CInside, all year
Guilá Naquitz Cave
Mexico · 302 km
- —Depth
- —Galleries
- 2,366 mEntrance altitude
- 13 °CInside, all year
Candelaria Caves
Guatemala · 381 km
- —Depth
- —Galleries
- 146 mEntrance altitude
- 26 °CInside, all year
Where these figures come from
| Name, type, published depth and length, visitors | Wikidata (Q16631902) · CC0 |
|---|---|
| The relief above, the entrance altitude, the section and the 3D model | Copernicus DEM GLO-30 · © DLR e.V., © Airbus Defence and Space GmbH, Copernicus/ESA |
| Climate | NASA POWER, 1991–2020 |
| Entrances, springs, sinkholes, opening hours and what is around | © OpenStreetMap contributors · ODbL |
| Images | EOX Sentinel-2 cloudless 2016 · CC BY 4.0; Wikimedia Commons |
Every figure is an average, an estimate or a count from a public dataset. Licences and methods: data sources.
The family
Do you prefer beaches, lakes, mountains, waterfalls, islands, rivers, canyons, caves, dark skies, viewpoints, birdwatching or forests?
Same idea, other landscapes: field atlases built on open data, month by month, in seven languages.
 beaches
 Find your beach: sea temperature, sun and swimming month by month.Visit
  lakes
lakes Every lake on Earth: water temperature, ice, depth and the shore.Visit
  mountains
 Every summit in 3D: summit weather, the 0 °C line, huts and trails.Visit
  waterfalls
 Every waterfall: height, flow month by month and when it roars.Visit
  islands
 Every island from the sea up: size, sea temperature, ferries and 3D.Visit
  rivers
 Every river from source to sea: the journey, the flow and the basin in numbers.Visit
  canyons
 Every canyon cut to scale: depth to the floor, rim and floor temperatures, trails and viewpoints.Visit
  caves
caves Every cave with its real depth and length: the rock above, the temperature inside all year, and how to visit.You are here
 dark skies
 Where the night is still dark: the sky of every place, the Milky Way month by month, the Moon, eclipses and auroras.Coming soonVisit
  viewpoints
 Every viewpoint with its real 360° panorama: the peaks you can name, how far you see and where the sun sets.Coming soonVisit
  birdwatching
 Every bird sanctuary and wetland with the species recorded month by month: who is resident, who comes for the summer, who only passes through.Coming soonVisit
  forests
 Every forest with its land-cover rings, what grows and lives in it, and the best months to walk it.Coming soonVisit